


Photo by Behnam Norouzi on Unsplash
Create Stunning Charts in Angular Apps with Echarts 5
Using Echarts inside of Angular


Angular is a popular web framework and robust platform for years and has been used for many projects and websites on any scale that has been developed by Google and the community. On the other hand, the Echarts is a powerful drawing chart library that has been created by the community. Echarts usage in the middle of Angular with is easy, so I will show you how to draw charts with Echarts in Angular apps in this post.
Install require packages
Chart sketching in angular needs a few npm packages echarts and echarts-for-angular. The Echarts package is a core package to draw charts on the web. Echarts needs some boiler code to integrate with angular, so the echarts-for-angular does this task and matches Echarts with Angular.
# if you use npm
npm install echarts -S
npm install echarts-for-angular
Also, some charts need the echarts-gl package provides capabilities of providing 3D plots, globe visualization and WebGL acceleration. To install the package use this command.
# if you use npm
npm install echarts-gl -S
Draw a simple chart
Now, it is time to sketch a chart and use the power of Echarts. To begin with, Add EchartsxModule to your imports section of your module.
  imports: [
    ...,
    EchartsxModule,
    ...
  ],
Now, echarts-for-angular added to your module and you can use its services and directives!
Let's go inside a component. Echarts-for-angular has a directive which need to add on a div element with the name of echarts. Also, the Echart needs to define an array of your needed components of the Echarts components and pass it to the Echarts directive which is extentions property of the echarts attribute. In the end, you should define a variable from your chart parameters and configurations. For this instance, I draw a pie chart but you can see other chart examples on the echarts site. I absolutely suggest you check it because it could draw very more complex charts.
<div echarts [options]="echartsOptions" [extentions]="echartsExtentions">
</div>
export class AppComponent implements OnInit {
readonly echartsExtentions;
echartsOptions: EChartsOption = {};
constructor () {
this.echartsExtentions = [PieChart, TitleComponent, TooltipComponent, LegendComponent];
}
ngOnInit(): void {
this.echartsOptions = {
title: {
text: 'Spending my time',
subtext: 'Fake Data',
left: 'center'
},
tooltip: {
trigger: 'item'
},
legend: {
orient: 'vertical',
left: 'left'
},
series: [
{
name: 'Time',
type: 'pie',
radius: '50%',
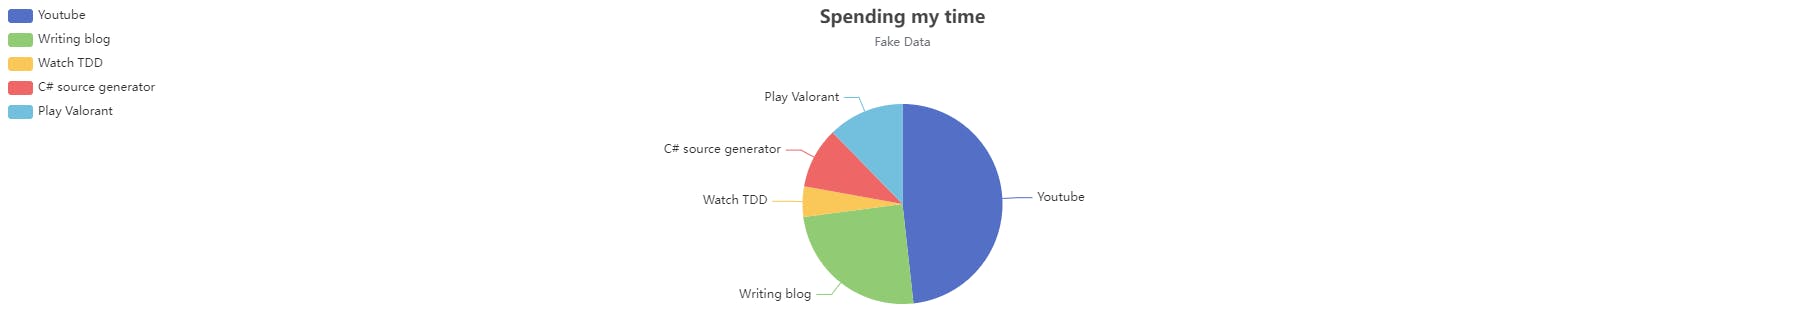
data: [
{ value: 980, name: 'Youtube' },
{ value: 501, name: 'Writing blog' },
{ value: 100, name: 'Watch TDD' },
{ value: 200, name: 'C# source generator' },
{ value: 250, name: 'Play Valorant' }
],
emphasis: {
itemStyle: {
shadowBlur: 10,
shadowOffsetX: 0,
shadowColor: 'rgba(0, 0, 0, 0.5)'
}
}
}
]
};
}
}
The result is this chart
If you do not understand some properties of the echartsOptions object check the echarts documentation.
Conclusion
To make a long story short, in this post I showed how to draw charts with Echarts in angular applications helping you and this is my goal. You can find the full project on GitHub. If you may have any questions or problems I propose you create a comment about it. I am here to help.